Do you really need a sledgehammer to crack a nut? (Part 2)

In the previous section (Microprofile, a knight or just another pawn [Part 1 of 2]), we implemented MicroProfile interoperable JWT RBAC. We also secured the resource with the help of the claim scope present in the JWT token received in the request. In this post, we will make use of other specifications like mpHealth, mpOpenAPI, and mpMetrics. You can either check out the source code from branch post-1 and code along. Or you can refer to the final code in branch post-2. So in this article. We will focus on three things namely:
- How to implement health checks.
- Documentation as per Open API Specification.
- How to expose metrics for data visualization.
MicroProfile Health
The specification of the used version can be found here. This feature provides a way to check the overall health of an application. The first check is the Liveness check, which confirms if the application is running or not. The second check, Readiness, confirms if the application is ready to serve all requests. The difference here is that the second check should provide the confirmation only if all dependencies are available, and if the application is in a state to perform the expected functions. It is, also, possible to combine both checks into one.
As per the documentation, the MicroProfile Health Check specification defines a single container runtime mechanism for validating the availability and status of a MicroProfile implementation. This is primarily intended as a machine-to-machine (M2M) mechanism for use in containerized environments like cloud providers. Examples of existing specifications from those environments include Cloud Foundry Health Checks and Kubernetes Liveness and Readiness Probes.
Implicit implementation
If we just have the feature (mpHealth-2.2) defined in the server.xml, we get a complimentary general health check. Just run the application, as is, and try to access the URL showing below:
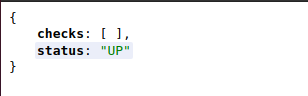
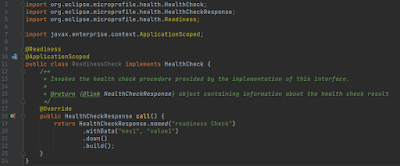
This just tells that the application is up and running. We will extend this by adding a new class as follows:

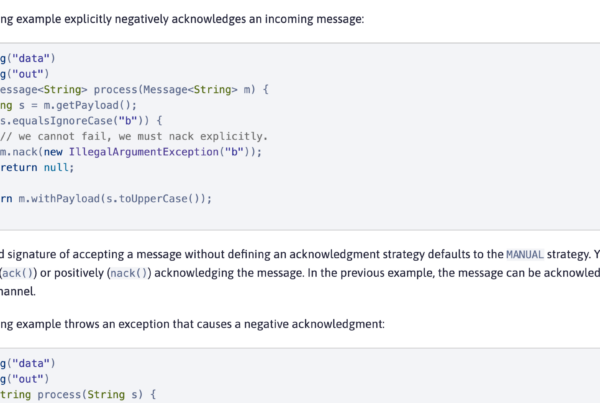
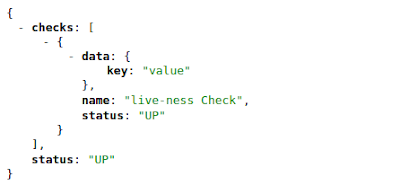
As per the specification, this adds additional information to the health data by implementing the HealthCheck interface. We override the default behavior on line 20. We added a check named “live-ness Check” with some payload. On line 22, we invoked method up(), which confirms the successful status, and then on line 23, we built this response to return. We annotated the class with @ApplicationScopped, which qualifies the class to be a managed bean. The @Liveness annotation tells the implementation to bind this with the health endpoint.
Accessing the same URL or this, you will do something like this:
If you change the invoked method at line 22 to down(), you will see the below on accessing the same URL.
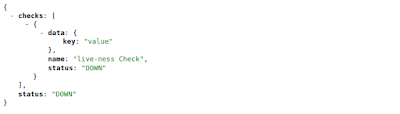
What’s important to note here; the overall status turns to DOWN if any specific check returns DOWN. Failure of any single check makes the whole application be qualified as DOWN.
Now let’s add one more class to the system as below:
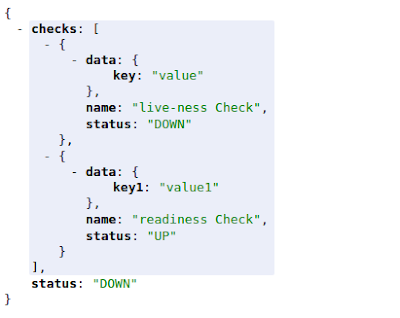
As you can see, this is similar to the previous HealthCheck implementation, just annotated differently. @Readiness with overridden behavior to make more sense for the readiness definition. If we now access the health endpoint, we would see the output below:
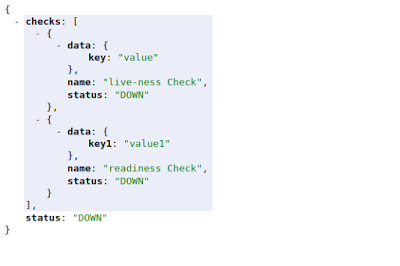
We now see, that in the overall health check we have two checks; one live-ness check, and one readiness check. In this specific case, both checks confirm the status as DOWN, and therefore, the overall status of the application health is DOWN. We can also access these checks using different endpoints as below:

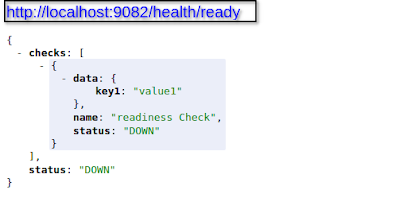
But, what if readiness check returns UP, but liveness check returns DOWN status, then the output of health endpoint would change as below:
The overall health of the application is still DOWN. The specific endpoints will give you different statuses now. The liveness check endpoint would return DOWN, but the readiness check endpoint would return UP status. This example was just to explain how these checks perform and contribute to overall application health, though this wasn’t an appropriate or ideal implementation, as per the definitions of Readiness and Liveness, as something should not be called ready if it is not live. I am sure you understand the point made here.
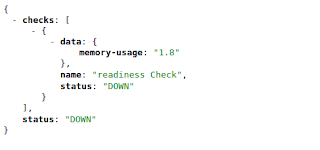
You can also derive the status of a check based on the specific condition, for example:
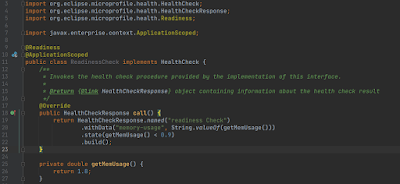
In the above example, the status would be derived from the condition specified in the state() method, so we will get the below output now:
One more thing to mention here is that you can also combine these into one as below:
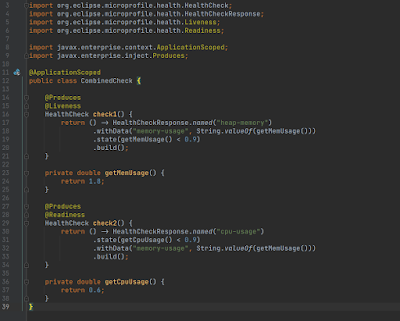
You will see the below output now on accessing the health endpoint:

I believe the output should be self-explanatory in terms of the response payload. The only thing to note here is that instead of keeping two classed we can make use of CDI to produce both checks.
Note: Pay attention to the import for Produces. It’s not JAX-RSduces. 😴 I once, by mistake, imported the wrong one and then wasted a lot of time trying to figure out what the problem was.
Now it comes to a specific application that will determine what to put where and how to decide on the different statuses to reflect the overall health of the application. I would suggest determining the liveness based on certain minimum responsible factors\parameters to be available so that the application can function as expected. On the other hand, the readiness should be based on all responsible factors\parameters, be available so that the application can function as expected in its completeness. (Like additional checks). You can assume that liveness is based on factors such as; the application is up and running, the database is accessible, etc. While the readiness, on the other hand, will have checks like the dependencies (integration service) are LIVE or heap usage is not above the alarming threshold value, etc.
As the last thing to discuss, just imagine if we keep all three classes and the system finds all these classes on the classpath. What would the behavior be? You are spot-on if you think the specification thought about it, and handled it gracefully instead of failing; in that case, we would get the output as below:
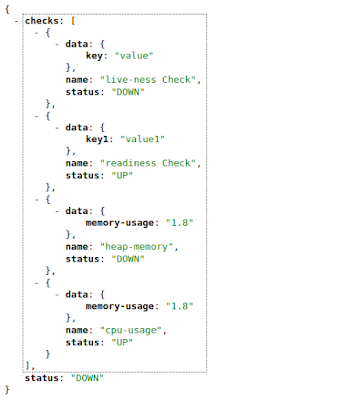
Overall application health status needs no explanation. All checks were considered and included, and therefore, contributed to overall application health status.
MicroProfile OpenAPI
The specification of the used version can be found here. It aims to provide a set of Java interfaces and programming models that allow Java developers to natively produce API contract documents as per OpenAPI v3 specification from their JAX-RS applications.
Implicit implementation
If you access the URL, you see something like this:
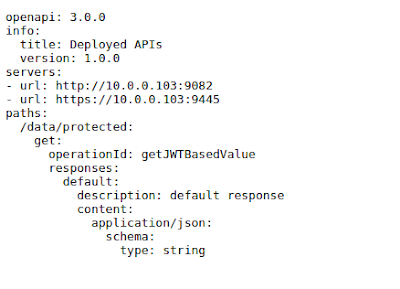
Just like the previous feature mpHealth, this feature also provides some generic implementation by following certain patterns. As you can see that operationId is generated using method names. path by merging ApplicationPath and resource path. response type from the Produce annotation defined on resource class. And others by reading the metadata from the actual method service the REST request.
You also get a web interface to host and render this specification and to provide you with more enriched UI on URL as below:
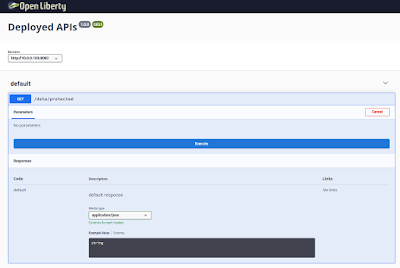
Just by specifying the feature, we are given these two endpoints; one to provide the contract, and the other to render the contract in a web interface. You can refer to the OpenApi 3 specification for more details about the possible information to be displayed as an API contract for REST services. As part of our next exercise, we will see how we can make use of MicroProfile to define some more of these.
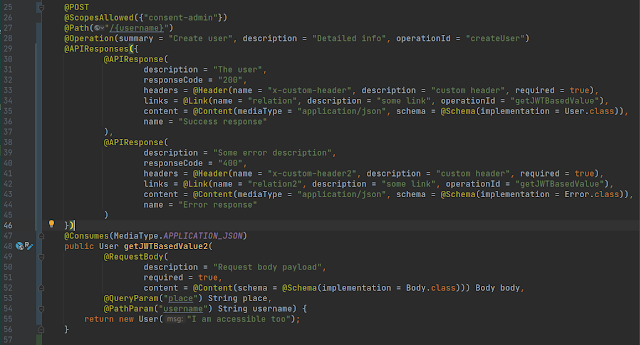
Let’s modify the ProtectedController as below:
Now if we access the UI, we see the first part i.e. the request as below:
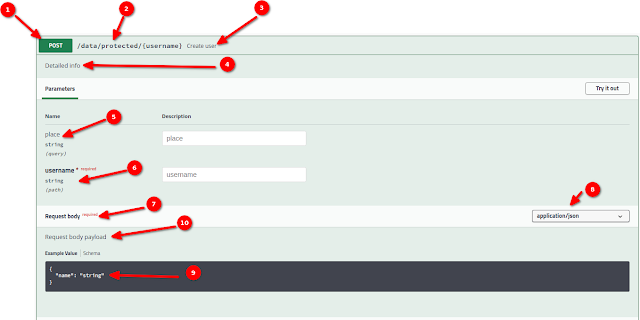
Here are some pointers regarding the numbered points in the above picture:
- Derived by the @POST annotation at line 25.
- Derived by merging ApplicationPath, resource path, and @Path annotation on the method.
- Derived from the defined summary in @Operation at line 28 in resource class.
- Derived from the defined description in @Operation at line 28 in resource class.
- Derived from the defined value in @QueryParam at line 53 in resource class.
- Derived from the defined value in @PathParam at line 54 in resource class.
- Derived from the declared annotation @RequestBody at line 49 in resource class.
- Derived from the declared annotation @Consumes at line 47 in resource class.
- Derived from the defined @schema in content @Content at line 52 in resource class.
- Derived from the defined description in @RequestBody at line 50 in resource class.
Let’s now see the response documentation:
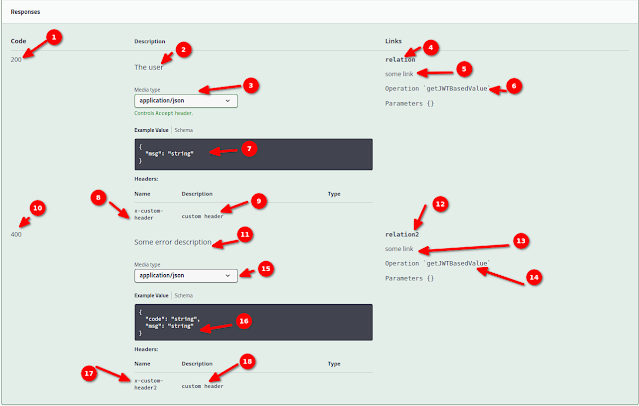
- Derived by the defined responseCode in @APIResponse at line 32 in resource class.
- Derived by the defined description in @APIResponse at line 31 in resource class.
- Derived from the mediaType in @Content at line 35 in resource class.
- Derived from the defined name in @Link at line 34 in resource class.
- Derived from the defined description in @Link at line 34 in resource class.
- Derived from the defined operationId in @Link at line 34 in resource class.
- Derived from the schema implementation in @Content at line 35 in resource class.
- Derived from the defined name in @Header at line 33 in resource class.
- Derived from the defined name in @Header at line 33 in resource class.
- Derived from the defined responseCode in @APIResponse at line 40 in resource class.
- Derived from the defined description in @APIResponse at line 39 in resource class.
- Derived from the defined name in @Link at line 42 in resource class.
- Derived from the defined description in @Link at line 42 in resource class.
- Derived from the defined operationId in @Link at line 42 in resource class.
- Derived from the mediaType in @Content at line 43 in resource class.
- Derived from the Error schema implementation in @Content at line 43 in resource class.
- Derived from the defined name in @Header at line 41 in resource class.
- Derived from the defined name in @Header at line 41 in resource class.
Let’s see now, how to define the configurable servers and security schemes.
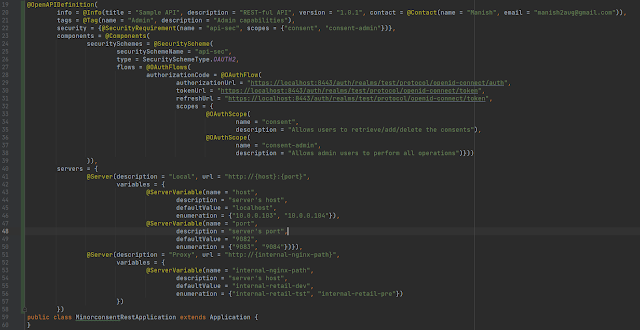
Here are some points to note:
Line 20: Defined the basic information about the API like title, description, version, and contact information.
Line 21: Some additional metadata (tags) for classification.
Line 22: Defined the application-level security requirements, along with scopes.
Line 23-39: Defined the security scheme of type OAUTH2 and defined the flow with all required details.
Line 40-58: Defined the servers, the first one is the server where we defined 2 variables each having 2 possible values and one default. The second server represents a way to generate the URL where variable replacement is not just enough.
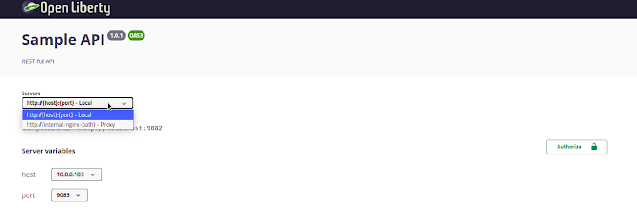
This would produce something like this:

The last important point about this specification is that it doesn’t restrict you to stick with dynamically generated API contracts on the fly by the code. If you prefer to code by having a contract first and keeping that a static resource, then that can be done easily by doing the following:
- Define the property (mp.openapi.scan.disable) with value as “true” in src/main/webapp/META-INF/microprofile-config.properties.
- Copy your API contract in src/main/webapp/META-INF/openapi.yaml.
Please note that the name and location of the API contract in step should be exactly the same, otherwise it will be ignored.
Microprofile Metrics
The specification of the used version can be found here. It aims to provide a set of metrics that can be consumed later by various data collectors like Prometheus to provide some time-series data, which, as a result, can be consumed by the data visualization tools like Grafana. This is something that you would want to check beyond the basic health check, and want to monitor on live applications. In the last part of this post, we would look into this aspect, and see what is offered by MicroProfile.
Implicit implementation
As we defined the feature (mpMetrics) in the server.xml, we get a complementary implicit implementation that can be verified by accessing the URL. It should look similar to the one below:
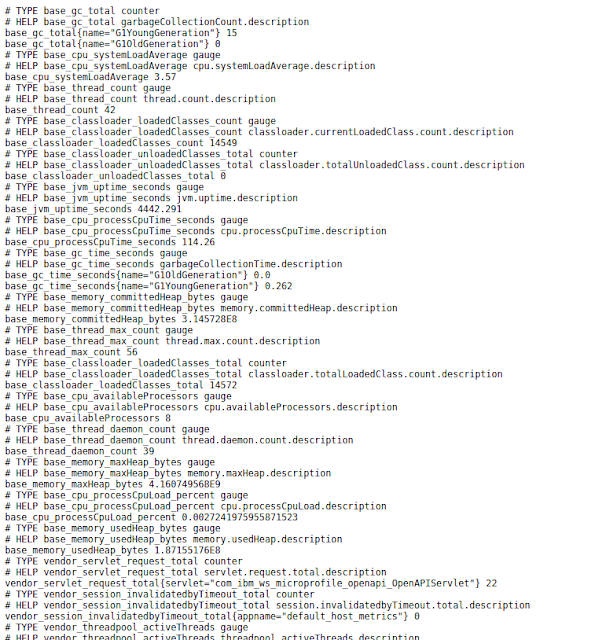
Runtime exposes some default metrics on start-up if server configuration contains mpMetrics feature. These metrics have 3 categories base, vendor, and application;.The metrics data is exposed in the OpenMetrics text format, version 0.0.4 as described in OpenMetrics text format.
As per the documentation:
Base metrics is a list of metrics that all vendors need to implement. Optional base metrics are recommended to be implemented but are not required. These metrics are exposed under /metrics/base.
Vendor metrics are the ones, MicroProfile server implementers choose to supply their specific metrics data on top of the basic set of required metrics. Vendor-specific metrics are exposed under /metrics/vendor.
Application metrics are the ones that are baked into the server as they are supposed to be provided by the application at runtime. Application-specific metrics are exposed under /metrics/application.
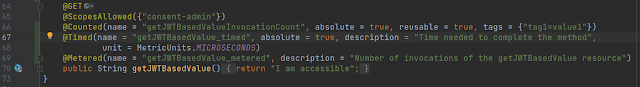
Let’s now try to use one of the MicroProfile annotations to track the number of invocations of the method. In ProtectedController resource class add annotation @Counted as per below:

Now let’s be a little impatient and try to access the URL. Surprised? It’s ok if you do not see anything. This is expected, as the method is not being invoked yet and, hence, we do not have any statistics. So, get a token and call the service, and then access the URL. You should see the below:

If we call the service again this counter would increase. We can use tags to organize the different counters in some categories if required.
Let’s modify the same resource method as below:
On accessing the URL for the application we should see something similar to the one below:

These metrics are useful for the live application running on production to generate some visual dashboards for monitoring and alerting purposes. The data collector can scrap the real-time data from running applications and a visualization tool can feed that data into live statistics visual graph or gauge. I cannot tell you how crucial this type of report or data can be when you encounter some issues in production. It can quickly give a glance at the current snapshot or for the past period of time.
I remember an incident when a bank reported system outages during the month-end. It was an on-premise system, so to collect the data we visited the client premises. Due to the highly confidential data, we had a very limited access grant. I felt as if they were keeping records of our mouse clicks. Jokes aside; we used the JMX console and collected the data. Believe me, it was not a pleasant experience, especially for a person who just joined the support team. Back then, if we had the tools that we have nowadays, our lives would have been a lot easier.
MicroProfile Config
We did not specify this feature explicitly as this is one of the dependencies of one of the other features and so runtime pulls it automatically. The specification of the used version can be found here. This specification defines an easy-to-use and flexible system for application configuration. It also defines ways to extend the configuration mechanism via an SPI (Service Provider Interface) in a portable fashion.
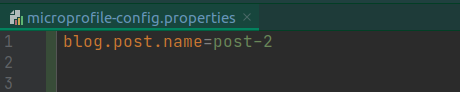
There are different levels of configs. In this section, we will go through them in detail. Internally, the core MicroProfile Config mechanism is purely String/String based. The runtime provides the type-safe values by using the proper Converters before handing the value out to the caller. The configuration key might use dot-separated blocks to prevent name conflicts, similar to Java package namespacing. Let’s define a config property in microprofile-config.properties file as below:
And updated ProtectedController as below:
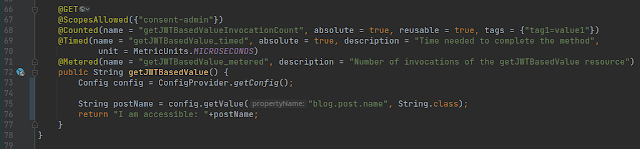
On line 73, we get the config object programmatically. On line 75, we retrieved the value of the property. If we now call the method we would be able to see the value of the property.
Another way of getting the Config object is via CDI. Let’s update the ProtectedController as below:

On lines 67-68, we injected the Config object. On line 80, we retrieved the value in the same way as before, the response of service print the fetched value.
Let’s now review another more convenient way to fetch the config property. Update the ProtectedController as below:
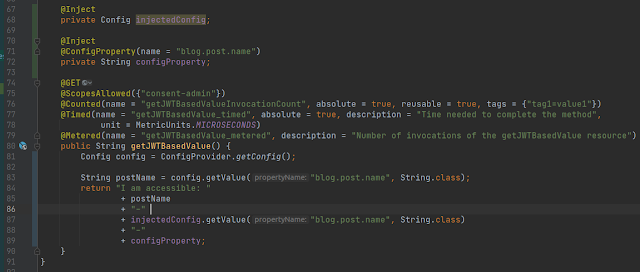
On lines 70-72, instead of the Config object, this time we injected the value of the property itself. It gives the same result. Let’s now see how the properties can be overridden, depending on the position they are defined in.
Case 1: config property defined only in @ConfigProperty using the default value, as below:

The response, in this case, would be as
I am accessible: config_property_annotation
Case 2: now add this property in microprofile-config.properties as below:

Response, in this case, would be
I am accessible: microprofile-config-properties.
Case 3: now create a file jvm.options in src/main/liberty/config, and add the property as below:

The output would be as below:
I am accessible: jvm-option.
Case 4: add the following line in server.xml:
<variable name=”property.location” value=”server-xml”/>
The output now would be:
I am accessible: server-xml.
Case 5: update the server.xml as below:

Output, in this case, would be the following:
I am accessible: web-application-app-property.
Below, is the picture from the open liberty guide, which explains it really well. Check this page for more details.

It’s time to end this post. I hope I have added a few drops to your knowledge sea. The working code and all the discussed concepts can be found at GitHub on branch post-2. Check it out by using the below command:
git clone -b post-2 [email protected]:manish2aug/minor-consent.git
Also, feel free to refer to the fully functional production code on the Main branch. Check it out by using the below command:
git clone [email protected]:manish2aug/minor-consent.git
Thank you for making time to read!
Notes from the Publishing editor:
Collaborative git issue